Introduction
Hello Everyone!!
I am Rohit Dandamudi, more commonly known as diru1100 in IRC and all other sites. I am currently doing my final year in Computer Science and Engineering at Chaitanya Bharathi Institute of Technology, Hyderabad. This summer, I had the wonderful opportunity to work with MetaBrainz Foundation and it’s my first time participating in GSoC. I worked on the SpamBrainz project under the guidance of yvanzo to make a step forward on eliminating spam in MusicBrainz.
How it started
I started looking for some cool projects to apply for GSoC, eventually, after going through some which were involved in the web development side, I finally got to know about the MetaBrainz Foundation, and it was already pretty late (around 2½ weeks before the proposal deadline), most of my fellow GSoCers were already in good rapport with the community by then. After looking through the project ideas, I wanted to do my project on CritiqueBrainz, but later I found out that it’s not considered for this year. In the end, I liked the concept of SpamBrainz and how it involves a good combination (Deep Learning and Web Development) of technologies. After browsing through the project I understood what I could and tried to make some changes to the codebase and was successfully able to run the model and add some documentation. Finally, I submitted the proposal, which got accepted.
The proposal
My proposal was focused on extending the work done by Leo as part of GSoC 2018. It mainly involved the following:
- Do the research and implement online learning to:
- Update the model dynamically as new variations of editor spam accounts appear.
- Make the model self-sufficient without depending on a particular file or a batch of data.
- Explore different types of learnings that are applicable to enhance LodBrok and for better performance in production.
- Complete SpamBrainz API to:
- Use and update the model with API calls.
- Connect LodBrok with MusicBrainz Server.
- Do detailed documentation to make the project more public and involve more contributors
Achievements
LodBrok model improvements
- Challenges faced initially were:
- There was less documentation.
- No access to real data.
- This made it a little difficult to understand the model, how it works, and what parameters are present, what is considered as spam or not, etc.
- To overcome this obstacle in the future, I have written a dummy data generation script.
- Have predicted using the model trained with generated data and got 100% accuracy against test data.
- Retrained the model to simulate online learning after doing a lot of research and considering the use case of LodBrok in MusicBrainz.
- Retrained the model with the simulation of taking spam as a non_spam account and it was able to predict the new learnings while still being able to remember the original non_spam accounts.
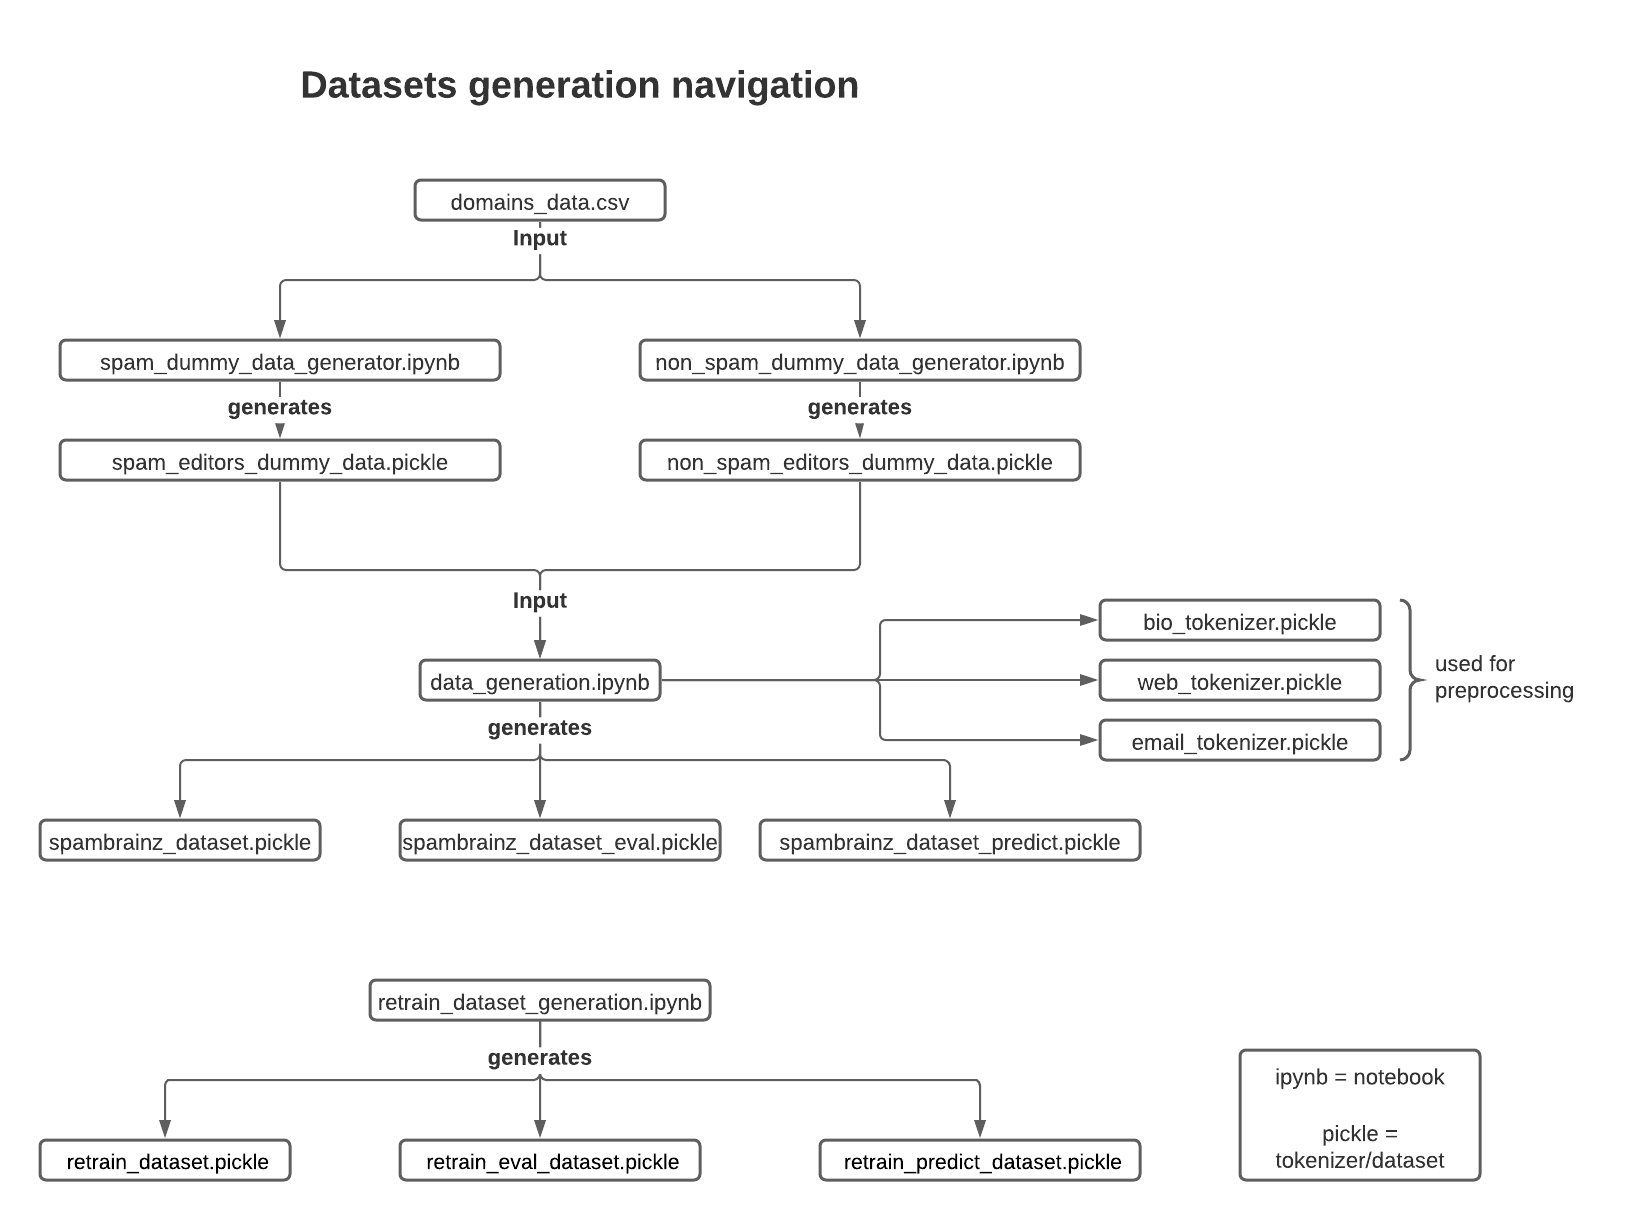
- Added detailed documentation about the model covering its usage, internal working, how to replicate locally with the help of images, helper functions.
- Finally, with all these included, the spambrainz_ml repo has released it’s first release v-0.1 with necessary binaries.
- Here is a navigation diagram explaining which notebooks and datasets are connected and the relationship between them.
Research for model live update
- To implement the online learning part I had to explore and test different methods with the generated dataset and LodBrok model. For this, I had to explore various resources such as Keras’ community forums, research papers, StackOverflow, courses, and blogs.
- A few of the interesting findings I have tested out were:
- Retraining the model
- This seemed to be the most obvious and easy fix to upgrade the model.
- This StackOverflow answer explains how retraining is done
- But some things to consider here are: a separate db has to be maintained to store the dataset and should be constantly updated by SpamNinja.
- This is not feasible overtime
- A lot of work is done to just transfer the data.
- Transfer Learning (TL)
- Official Keras blog explanation about the feature extraction and fine-tuning methods of TL.
- Transfer Learning mainly involves deriving a new model from a pre-existing successful model (LodBrok) known as feature extraction to tackle similar cases.
- I was inspired by the fine-tuning feature of Transfer learning which has a similar learning method as the one I implemented.
- Online Transfer Learning (OTL)
- This, as the name suggests is a combination of online learning and Transfer learning, which helps us to define models that can learn to classify similar spam accounts in MetabBrainz.
- This research explains about OTL and it’s use cases in the production environment.
- The concept of model drift:
- This article explains how the model degrades over time, the reasons for this, and how to handle it without depending on the production environment.
- This is useful to know as it is needed when the model is finally in production handling real data.
- Retraining the model
- In the end, I decided to go with refitting the model with a slow static learning rate, this seemed to be the best solution for the following reasons:
- No need to store editor details for false-positive and false-negative cases respecting MetaBrainz’s data privacy rules.
- The model won’t go through catastrophic forgetting (forget old learnings of what is spam or not) and will be able to learn new patterns in spam accounts over time.
- The structure of the data isn’t changing over time (editor account fields remain the same).
- Resources which helped me make this decision:
- Keras community help discussion about the same exact problem (online learning in Keras for an LSTM model [LodBrok])
- StackOverflow answer explaining catastrophic forgetting and role of fit function
- Machine Learning mastery blog article explaining the importance of learning rate on a model
- Reading research papers similar to this one covering online deep learning and consulting professors.
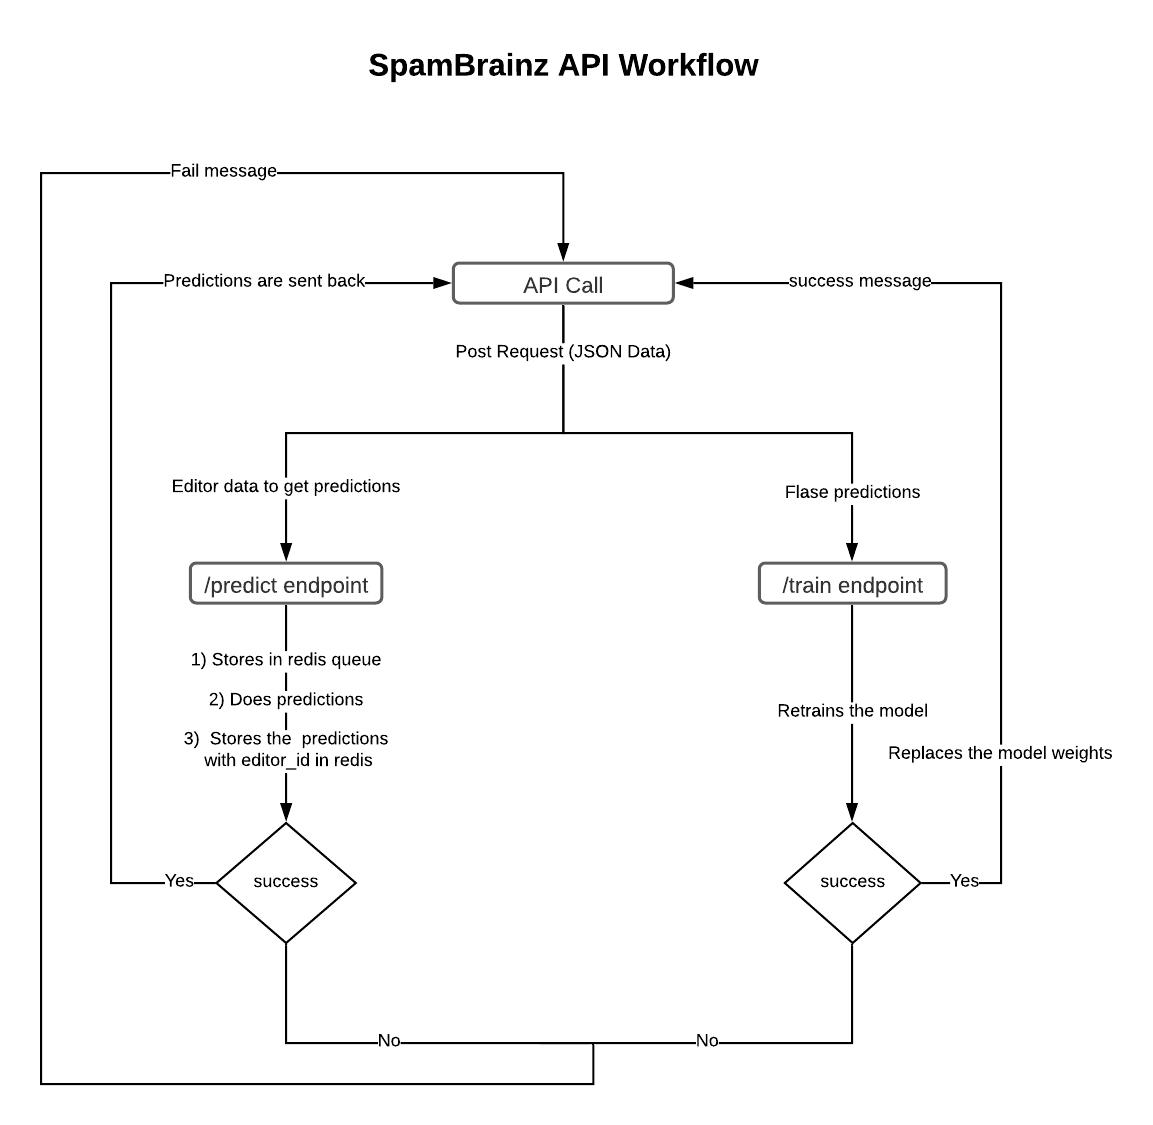
SpamBrainz API
- Incorporated the above research in SpamBrainz API, which consists of 2 endpoints, namely:
/predictto return classification results by LodBrok for the editor accounts/trainto retrain the model with incorrect results sent to SpamNinja respectively
- After discussing with Leo, I decided to implement the API using Flask and Redis combination. Going with Redis over RabbitMQ for this API is feasible as the API is pretty lightweight and has at most 2 events.
- Documented the entire API, with internal working, steps to replicate, and images to understand the results obtained.
- Completed dockerization of SpamBrainz_API for easier integration and testing with MusicBrainz docker.
- This diagram explains the current workflow of the implemented API:
Challenges ahead and future of SpamBrainz
- The API has to be integrated with MusicBrainz and should undergo more testing with real live data, currently, my focus is on this part.
- Note: All the work done till now on the model was on dummy data generated by scripts that tend to replicate the real accounts as much as they can be, by taking into account the inputs from Freso, yvanzo, and the analysis done by Leo, without affecting the data privacy policy.
- To extend online learning to other use cases in MetaBrainz through Transfer Learning and Online Transfer Learning.
- Also looking forward to writing a research paper about the work done, and eventually publish it in IEEE transactions, as I plan on using SpamBrainz as my final year major project.
Special thanks to…
- My mentor, YvanZo for being incredibly patient with me, helping me create quality commits, and overall making me a better programmer. Have always learned something new in every interaction with him.
- LeoVerto, for helping me out whenever stuck and getting me up to date with the project.
- MetaBrainz Foundation, for creating an open, inclusive, and productive environment to build some amazing stuff.