Hi everyone, I am Prabal Singh currently studying in Indian Institute of Technology, Guwahati. This summer I participated in Google Summer of Code and developed a new feature – User Collections – for the project BookBrainz.
Hey! My name is Shivam Kapila (shivam-kapila on IRC) and I am a final year undergrad at National Institute of Technology Hamirpur. I have been working on the ListenBrainz project this Summer as a participant of the Google Summer of Code program. The past four months were full of fun, hacking and loads of music!!
Landing into the MetaBrainz Community!
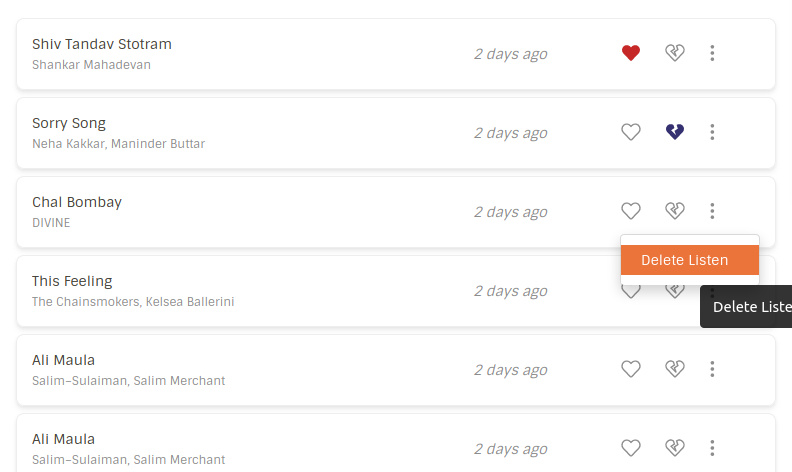
My journey with MetaBrainz began in late January this year, when I introduced myself to the community. My first PR improving the developer documentation was by adding parts connected with setting up the Spark infrastructure on a local setup along with consolidating and improving bits of documentation. I delved into real code while implementing front end components for Deleting Listens. Over the next few months, I fixed various bugs like making the Importer Modal responsive, fixing the DB setup scripts, fixing pagination issues while browsing listens, handling stat calculation errors in the Spark Reader and flushing user stats when they delete their listens.
As a GSoC applicant, I proposed to add various Listen Management features like love/hate (aka feedback) and deleting individual listens in ListenBrainz. I also proposed a new design for the Listens page. This involved a lot of designing and research, going through UI/UX design guidelines and tuning colors, shades and shadows till we arrived at a presentable and subtle design.
And finally I onboarded the GSoC train 🙂 .
Bonding with the community
I had been a part of the community since January so I was familiar with how things work in ListenBrainz. So I decided to contribute to the TimescaleDB migration where we moved our primary listen store from InfluxDB to TimescaleDB, opening up a ton of features for us to work on. Here is the final migration PR containing the commits of my contribution.
As the official coding period began, I started working on my proposed tasks. The first question was: how to store the feedback? So I began implementing the database changes to store the recording feedback and applying the necessary changes in production. Following this I added a Python module to interact with the database and implemented a Pydantic model to validate the feedback records before they are stored in the database or served over the API. Then I added the necessary APIs to store and fetch the feedback for a given user or recording. This was followed by improving the efficiency of the DB module.
I also worked on dumping the recording feedback in the ListenBrainz public dumps. Since ListenBrainz had migrated the stats calculation infrastructure from Google BigQuery to Apache Spark I also removed the BigQuery references from the ListenBrainz website. Now that the timescale migration work became stable, I began working on Delete a Listen feature.
Pulling out the front end brushes
Now that the base was ready for us to work on, I started working on the React components so that the feedback and deletion feature could actually be presented on the website. Around the same time, the Timescale release day was also getting near, so I helped with a few tests and finished up the work for deleting listens. The front end components also started looking good and we were ready to associate the back end with them.
Rectifying & Reactifying
It’s high time and the final phase started. Now that we were ready with a few components we needed some tweaks in some production components to make them subtle. Hence I shot an improvement PR to tweak some shadows, adjust some fonts, adjust heights of the components, sticking the footer to the bottom, and reactify the loading spinner. Then came the Listen Count Card denoting the number of listens for a user. Following this we moved to Card based design for displaying listens.
This was followed by the much awaited feedback controls and now we can love/hate the songs from our listen collection. Isn’t this amazing! There were some needed minor tweaks needed to handle the ‘playing now’ listens correctly. At the same time, following the MetaBrainz guidelines to write quality code, I worked on making the SQL queries more readable. Then came the much awaited Delete a Listen feature and now we can finally get rid of the embarrassing listens!!
Oh, now comes the time when we talk about the current scenario. The tasks currently on my radar are adding cover art support so that the page looks more alive and improving the Spotify imports to only import listens that were listened by the user after the latest Spotify listen we have for them.
After this I aim to work on the recommendation stuff that’s being actively pursued by the team. Also Mr_Monkey and me had been working on some design concepts for the All New ListenBrainz. I am pretty excited to work on it. Wanna take a sneak peek?
A new fam
The journey with MetaBrainz has been so amazing, that I am so tempted to stick here. I feel ecstatic to be a part of GSoC with the best org 🙂 . The best part is – it’s never all about code. There’s a lot to gain. Each day marked gaining maturity and thinking more and more like a real developer. I started feeling at ease with the communicate → code → integrate chain. It really feels fortunate to be a part of the MetaBrainz family where everyone is a ping away <3 .
GSoC marks the kickstart of my journey with MetaBrainz and I will be here lurking on IRC, shooting PRs to make the projects more and more awesome.
Heartiest Gratitude
Robert Kaye (ruaok) for being a mentor and a companion, guiding me through the dev life and real life.
Param Singh (iliekcomputers) for always keeping the spirits high.
Nicolas Pelletier (Mr_Monkey) for guarding me against Cascading Snot Swab issues.
Alastair Porter (alastairp) for fishing out the best practices from his pool of intelligence.
Vansika Pareek (pristine___) for some awesome playlists.
Hey everyone! I am Ishaan Shah (ishaanshah), a sophomore at International Institute of Information Technology – Hyderabad, India. This summer, I worked on ListenBrainz as a participant in Google Summer of Code ’20. My project involved generating statistics and visualisations for users using Apache Spark. This blog is an overview about the work I did and my experience working with ListenBrainz.
I started contributing to ListenBrainz in January 2020. My first PR was for LB-179, a small Quality of Life improvement to the LastFM importer. My first major contribution was porting the LastFM importer to ReactJS. Over the next two months, I continued working on the frontend, where I mainly worked on improving the frontend infrastructure by adding support for automated testing, porting the codebase to TypeScript and standardising the frontend code using ESLint and Prettier.
After making a few patches, I understood how ListenBrainz worked and got comfortable with the codebase. I decided to make a proposal for adding statistics to ListenBrainz using Apache Spark. While writing the proposal, I referred to many other websites, blogs, as well as community discussions for different ideas about statistics which could be added. After some research, I narrowed down on the specific graphs and statistics that I wanted to calculate during GSoC.
Community Bonding Period
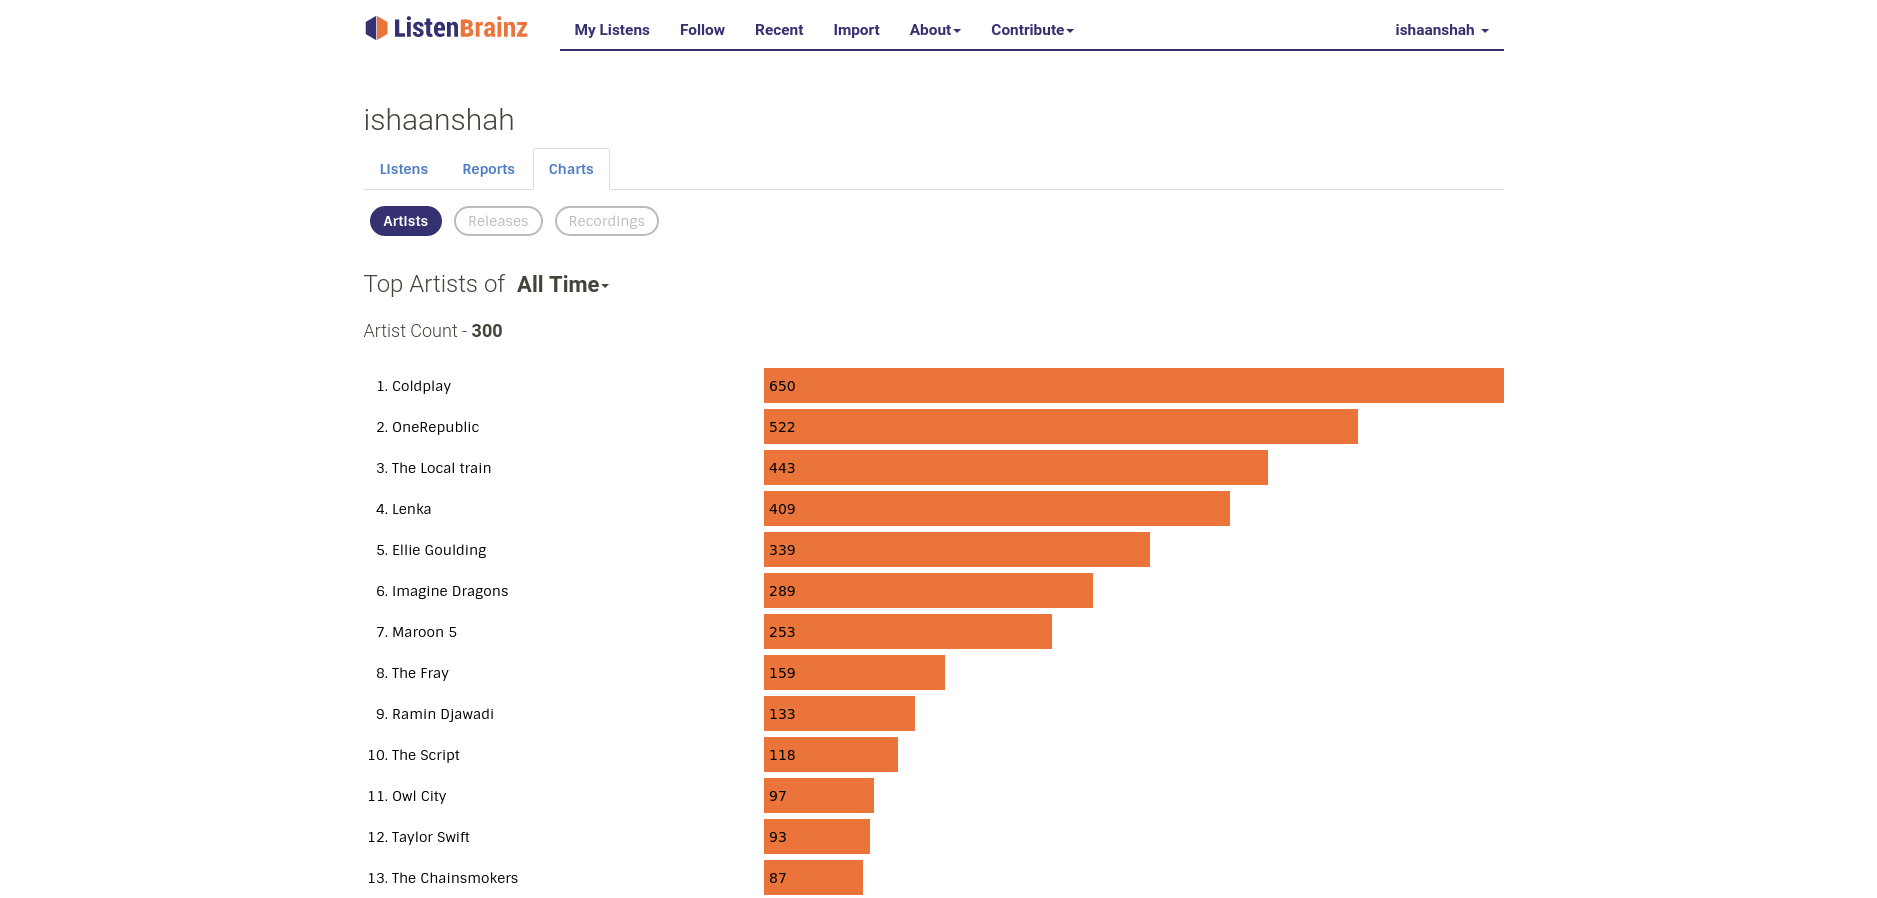
Since I had been working with the MetaBrainz community since January, I was familiar with how things worked in the community. So we decided to use the Community Bonding Period for fixing and updating the Top Artists charts for a user. The first task that I took up was to add an API endpoint for fetching the Top Artists data for a user programmatically. Until then, I had mostly spent my time working on the frontend, this task helped me in getting familiar with the backend architecture. Next, I worked on porting the Top Artist graph from d3 to nivo – a charting library built with ReactJS and d3. The Top Artists graph only supported All Time statistics before. I worked on adding support for more time ranges. This was the first time I worked with Apache Spark and the PR for this took quite some time, but it was essential that we got it right as most of the statistics we built further would use a similar workflow. After we were satisfied with the overall flow of the data from our Spark cluster to the web server, I started working on showing the stats for different time ranges on the website. Although this task seemed easy at first, it took much longer than expected. We encountered some bugs and received some user feedback when we deployed the graph to production. The rest of this period was spent on incorporating the user feedback and fixing the bugs.
Top Artists
First Coding Period
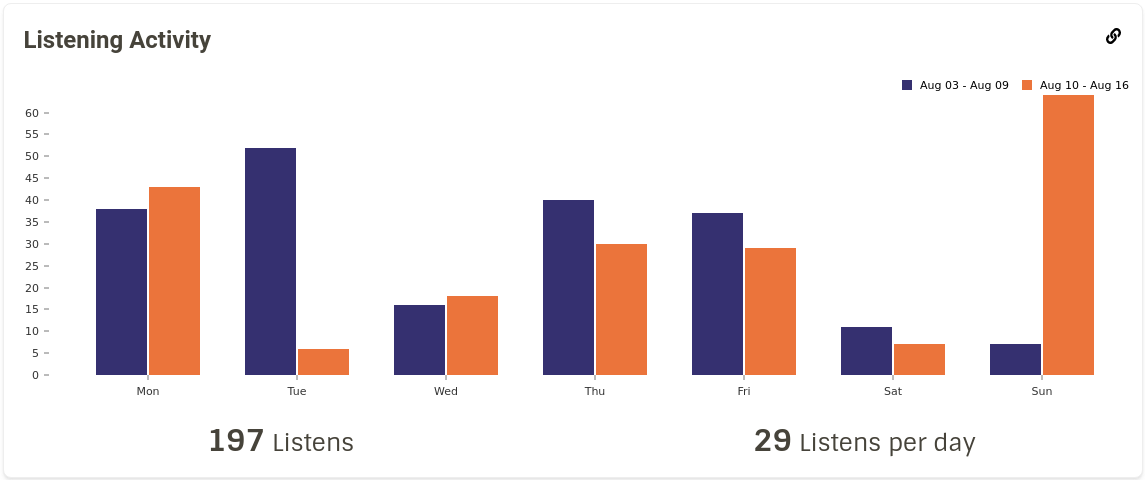
We now had a somewhat stable pipeline for calculating the stats and sending them to the server. I started working on the backend for Top Releases stats for a user. We ran into memory issues when calculating these stats on the cluster, so I spent some time finding the cause of the issue and realised that we were collecting the results all at once which was causing the driver to run out of memory. I fixed this by collecting the results for each user separately and tweaking some RabbitMQ parameters to make sure that messages aren’t dropped while sending them to the server (PR #897). After this, I added Top Recordings for a user. Now we had a brand new Charts page that displayed the user’s Top Artists/Releases/Recordings for different time ranges. Next I started working on temporal statistics for a user i.e, number of listens in a past time range. The query that I wrote for calculating this data turned out to be pretty inefficient for larger datasets. So I ended up writing two versions of the same query: one for large datasets and one for smaller ones. While working on displaying these stats on the frontend, I tried various representations of the data. I finally settled on displaying the data as bar graphs, as shown on this report view.
Listening Activity
Second Coding Period
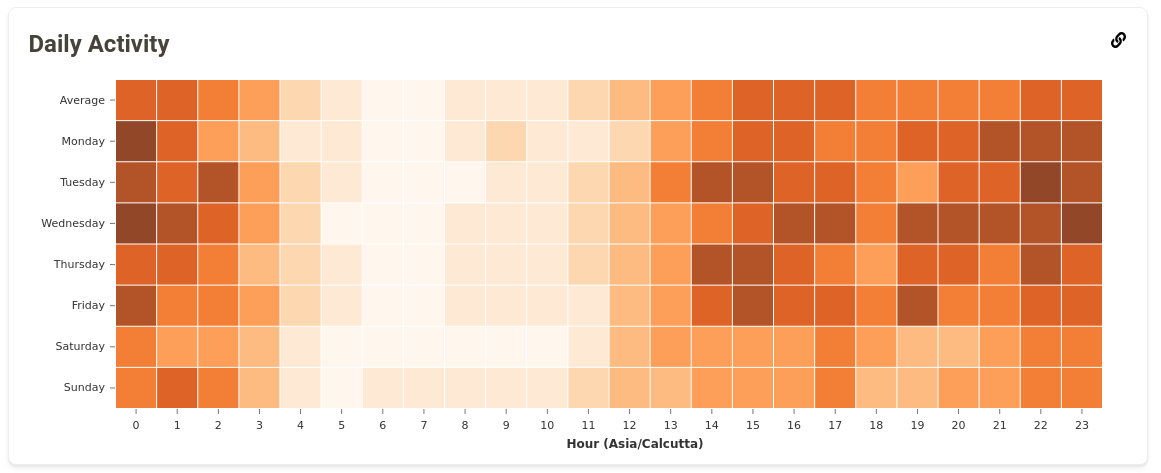
I added two more graphs in this period: Daily Activity and Artist Origins. The Daily Activity graph shows the number of listens a user has at a particular time of the day. I implemented the query for calculating this data in a slightly different way compared to the Listening Activity query. This change improved the query speed significantly. I had some trouble finding a correct way to represent this data. My mentor helped me in this by suggesting the usage of a Heatmap, and the results turned out to be pretty good.
Daily Activity
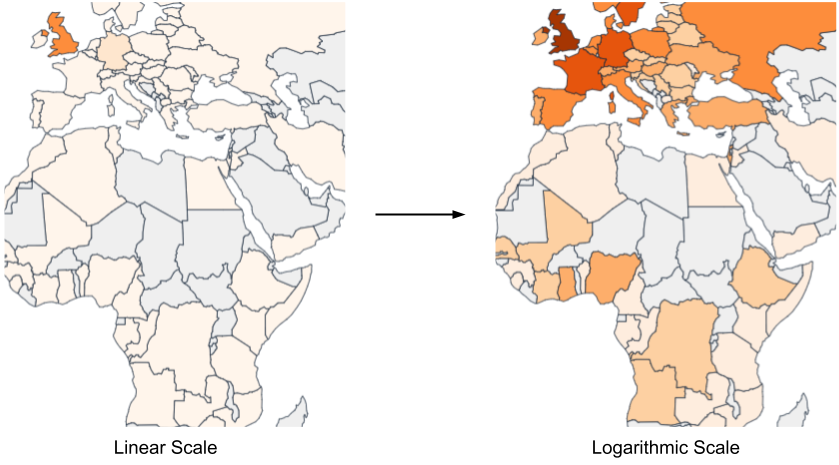
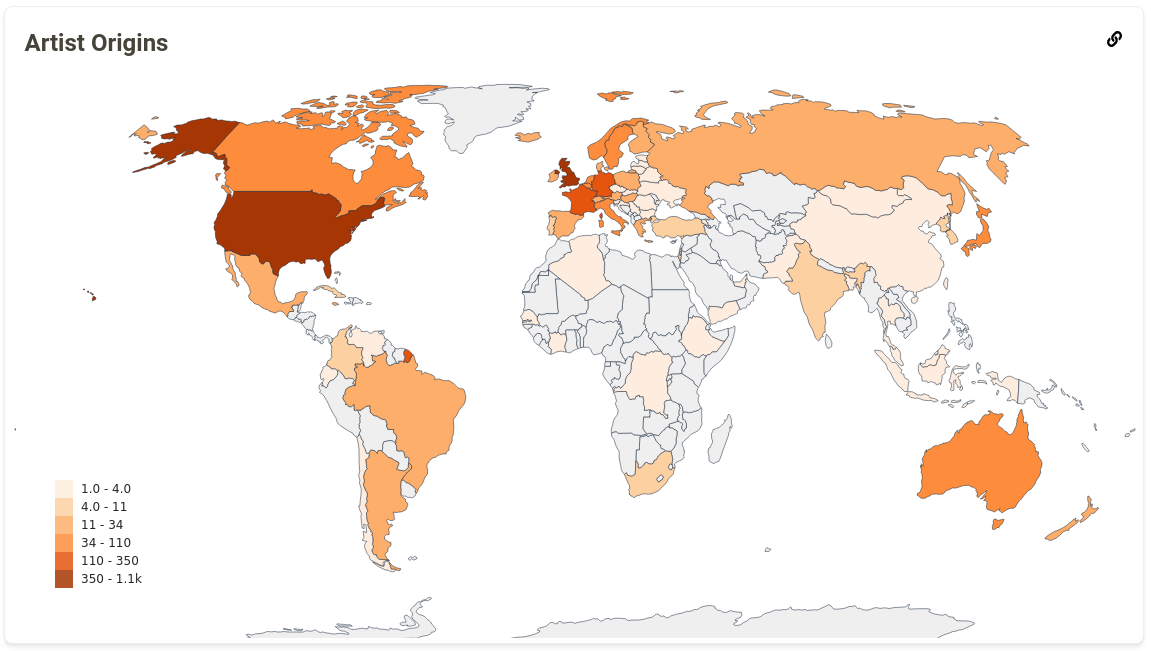
Next, we worked on the Artist Origins graph, which provides an insight into the geographical diversity of a user’s musical taste. I had a lot of help from the ListenBrainz team for this graph and I couldn’t have done this graph without their help. This was by far the most interesting stat that I worked on during the project. Furthermore it laid a general framework to calculate statistics using the data from MusicBrainz. After deploying this map on production, we received feedback from the users that the map looked plain for most of them and there wasn’t much colour difference between different regions. This happened because people generally tend to listen more songs from their home country, so there is a huge difference between the country with maximum artists and average number artists from other countries. We fixed this issue by changing the colour scale from linear to logarithmic.
Final Coding Period
We now turned our attention towards calculating some stats for the whole website. We decided to make a graph for the Top Artists over different time ranges. We thought that this would be relatively easy given that we had already done something similar for individual users before. However we hit an unexpected bump; the data we were calculating was not accurate, mainly because of various different sources of the artists and some minor changes in the artists’ name or metadata resulted in a different entry with a different listen count for the same artist. Moreover, we found a couple of users spamming our website for self promotion and we did not have a solid way to deal with this. Around this time, my college resumed and the amount of time I could dedicate to LB reduced severely. So we decided to use the remaining time to work on improving the frequency at which stats are updated. I have an open PR (#1052) for doing this at the time of me writing this blog and we should be able to implement this functionality in the near future.
Artist Origins
Experience
The past 4 months have taught me a lot of things. I learnt new technical concepts everyday. I started writing code as a developer rather than a programmer. I understood the importance of proper unit and integration testing (even though it was my least favourite part while adding a new functionality). I also found it much easier to talk and interact with people both online and in real life. Frequent deployments of new features to production helped us a lot. We were able to catch bugs when we still had some context over the code written and also received feedback from the users about how we could improve the new features added. It also kept me motivated to keep working on new graphs and statistics and gave me a sense of satisfaction when I saw them on the production server. I also learnt that things don’t always go the way we expect them to. More often than not, you will run into some bumps while adding new features so it is better to keep some extra time to deal with these issues.
GSoC gave me a wonderful opportunity to work with some amazing people from all over the globe. I was not able to complete all the graphs that I had planned for this summer, but I do plan to continue working on ListenBrainz to add more statistics and new features.
Special Thanks
Param Singh (iliekcomputers) for being an amazing mentor and helping me whenever I was stuck on an issue.
Robert Kaye (ruaok) for providing some really insightful feedback and the MusicBrainz data that was required for calculating the Artist Origin map.
Nicolas Pelletier (Mr_Monkey) for helping me with the frontend for the user Charts page and providing some amazing tips for ReactJS.
The summer heat is still with us, and also hot out of the oven is a new MusicBrainz server update! This time we have a fair amount of fixes for the “Set cover art” page (which allows you to select a specific cover art from releases to represent a release group). Some other improvements have been made, some small bugs fixed, and the conversion to React marches on firmly.
A recent change had standardized all edit listings to 100 edits per page (it used to be 25 in some places and 100 in others before that). We’re lowering that to 50 with this update to try and make the edit lists a bit less overwhelming but still not too short that related edits get split over too many pages. Do let us know whether it feels better!
Finally, we disabled URLs marked as ended (since they are often squatted and full of ads) and URLs from domains reported as (hopefully temporarily) compromised. You can still copy the URL itself if you want to check it through the Wayback Machine to try and find out what is/was there!
A new release of MusicBrainz Docker is also available that matches this update of MusicBrainz Server. See the release notes for update instructions.
Thanks to jesus2099 for contributing code. Thanks to bsammon, hibiscuskazeneko, lotheric, mrclon, murdos, nikki, sothotalker, tigerman325, tularion, and yindesu for having reported bugs and suggested improvements. Thanks to Besnik and salorock for updating the translations. And thanks to all others who tested the beta version!
This release includes even more fixes to previous 2.4.x releases. It fixes some annoying bugs and improves overall usability. Documentation links inside the application were updated to point to picard-docs.musicbrainz.org (thanks to the great work rdswift did).
Following yesterday’s release of Picard 2.4 we have a bugfix release that fixes Picard not starting on Windows 7 and Windows 8. Users of those operating systems should upgrade to Picard 2.4.1.
After a slow summer month, and hot on the heels of the release of Picard 2.4, an update for MusicBrainz Server has finally arrived, fixing ten bugs, converting almost as many templates to React, making small improvements and bringing a few handy new features.
A new release of MusicBrainz Docker is also available that matches this update of MusicBrainz Server. See the release notes for update instructions.
Thanks to Cyna and loujin for contributing code. Thanks to aerozol, chaban, cyberskull, fabe56, hibiscuskazeneko, ijc, jesus2099, Kid Devine, Nero Apunto, and yindesu for having reported bugs and suggested improvements. Thanks to kellnerd and mfmeulenbelt for updating the translations. And thanks to all others who tested the beta version!
The Picard team is happy to announce that version 2.4 of MusicBrainz Picard is now available for download. MusicBrainz Picard is the official tag editor for the MusicBrainz database and helps you get your music collection sorted and cleaned up with the latest data from MusicBrainz.
This releases brings significant performance improvements, improved documentation, new features and many bugfixes.
What’s new?
Better performance and responsiveness
Picard 2.4 features heavily improved performance and responsiveness of the user interface when loading or saving a large amount of files.
Improved online documentation
There is a completely new User Guide for MusicBrainz Picard, which replaces the documentation previously available on the Picard website. This documentation is much more complete and easier to update and maintain.
We are also looking for contributors who help to improve the documentation. If you have some ideas for improvements have a look at the Picard Docs project on GitHub.
Support for tagging WAVE and DSDIFF
Picard now finally supports writing tags to WAVE files. This was previously not possible, as there is lack of a proper standard to tagging WAVE files. Now Picard will allow you to write ID3v2 tags to WAVE files. As this is not supported by all players and tagging tools, Picard can optionally fall back to writing RIFF INFO tags to the files. Just be aware that RIFF INFO is very limited in regards to tags available and support for non latin character sets.
As a new file format Picard now supports DSDIFF (also known by their file extension as DFF) files. These can be loaded and saved using ID3v2. Similar to WAVE there is no standard way for tagging DSDIFF files, but many playback tools which support DSDIFF also support the ID3v2 tags.
Script auto completion and inline documentation
The script editors in the options dialogue (both for file naming and metadata scripts) now support auto completion for function and variable names. In addition there is a new script documentation dialogue, which shows the documentation for all scripting functions without the need to open the online documentation in your browser.
Dark mode support for Windows 10
On Windows 10 Picard now respects your settings for the Windows dark mode. If enabled, Picard will use a dark color theme and optimized syntax highlighting. This work also allows us to further improve Picard for dark themes on other platforms in the future.
Updated translations
With this release a lot of translatable text has been added to Picard, and many translations have been updated.
But not all translations are completed and we always need help maintaining the translations for Picard. Translating is easy and can be done online: Head over to MusicBrainz’s translation page on Transifex and click on “Help Translate MusicBrainz”. Any changes to the translations will be included in the next release.
More changes and bugfixes
Picard 2.4 has many more improvements and fixes. See the full changelog for details on all changes since the last stable Picard 2.3.2.
Download
Picard 2.4 is available for download from the download page. For Windows 10 users installing from the Windows Store an update will come automatically as soon as the new release has been approved by Microsoft.
Acknowledgements
This release contains code changes by Gabriel Ferreira, Laurent Monin, Bob Swift, Philipp Wolfer, RaysDev, Wieland Hoffmann and new contributors Adam James, jcaesar and elvquant.
Special thanks go to Gabriel Ferreira for his excellent work in profiling and improving Picard performance and to Bob Swift, who completely overhauled Picard’s documentation, making it much more complete then it ever has been, and to all the translators who updated their language translations on Transifex.